


The amount of freight flowing between the U.S. and its NAFTA partners, Canada and Mexico, increased 8.5% in July from the same time a year ago.
New U.S. Transportation Department figures show it totaled $101.1 billion, with increases in all five major transportation modes: air, vessel, pipeline, rail, and trucks. This is the fifth consecutive month with U.S.-NAFTA freight flows exceeding $100 billion.
Percent change in the value of U.S.-NAFTA freight flows by mode, July 2013 - July 2014. Graphic: U.S. DOT
The amount of freight flowing between the U.S. and its NAFTA partners, Canada and Mexico, increased 8.5% in July from the same time a year ago.
New U.S. Transportation Department figures show it totaled $101.1 billion, with increases in all five major transportation modes: air, vessel, pipeline, rail, and trucks. This is the fifth consecutive month with U.S.-NAFTA freight flows exceeding $100 billion.
Of the $7.9 billion increase in the value of US-NAFTA freight from July 2013, truck freight contributed the most, $4.7 billion, followed by rail, $1.4 billion. The trucking increase was due to growth in truck freight with both Mexico, up $2.5 billion, and Canada, up $2.2 billion.
Trucks carry three-fifths of U.S.-NAFTA freight and are the most heavily utilized mode for moving goods to and from both U.S.-NAFTA partners. Trucks carried 59.2% of U.S.-NAFTA freight in July 2014, accounting for $30.5 billion of exports and $29.3 billion of imports.
In July, the value of commodities moving by pipeline grew by the largest percentage of any mode, 10.8%. Rail freight increased 10% followed by a truck increase of 8.5%, vessel increase of 5.6%, and an air increase of 1.2%.
U.S.-Canada Freight
Year-to-year, the percent change in the value of U.S.-Canada freight moved by vessel increased the most of any mode, growing 30.9%, followed by a pipeline increase of 10.7%. Freight moved by rail increased by 8.5%, truck by 8%, and air by 2%.
Trucks carried 52.7% of the $55.2 billion of freight to and from Canada, followed by rail at 15.2%, pipeline at 14.8%, vessel at 6.3% and air at 4%. The surface transportation modes of truck, rail and pipeline carried 82.8% of the total U.S.-Canada freight flows.
In July 2014, the top commodity category transported between the U.S. and Canada was mineral fuels, of which $8.1 billion, or 60.2%, moved by pipeline.
U.S.-Mexico Freight
Year-to-year, the value of rail freight rose 12% in July, the largest percentage increase of any U.S.-Mexico mode. Freight moved by pipeline increased 11.4% and truck by 8.8%, while air and vessel decreased by 0.1% and 5.3%, respectively.
Trucks carried 66.9% of the $45.9 billion of freight to and from Mexico, followed by rail at 14.2%, vessel at 12.6%, air at 2.7% and pipeline at 0.9%.
The top commodity category transported between the U.S. and Mexico in July 2014 was electrical machinery, of which $7.6 billion, or 91.7%, moved by trucks.

ACT Research data shows volumes hitting a four-year high and supply-demand balance strengthening, but higher oil prices are undercutting tariff relief and tempering optimism.
Read More →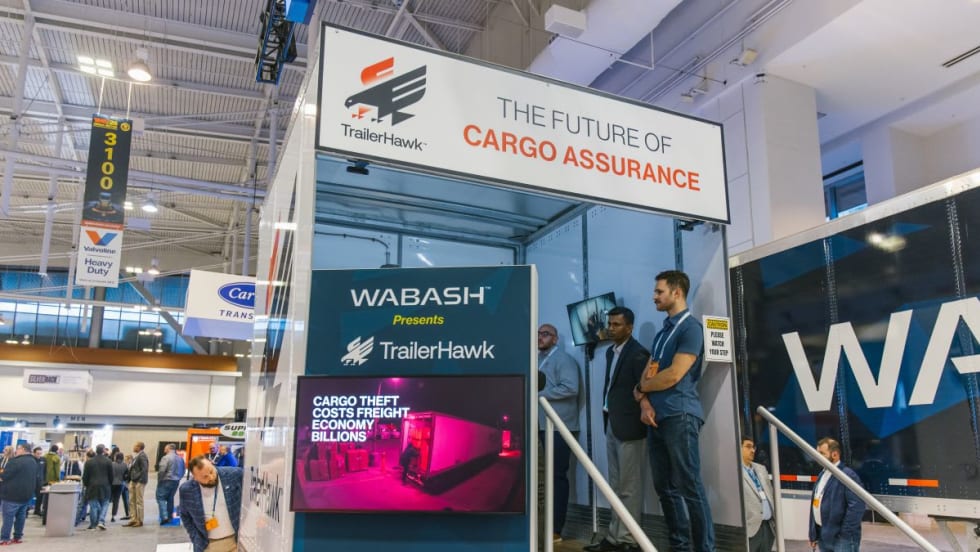
The patent-pending cargo solution integrates a digitally connected cargo door and an intelligent locking system with the TrailerHawk.AI technology platform.
Read More →
The impact of the Iran conflict extends beyond fuel costs, bringing more fraud and cybersecurity risks to the trucking industry.
Read More →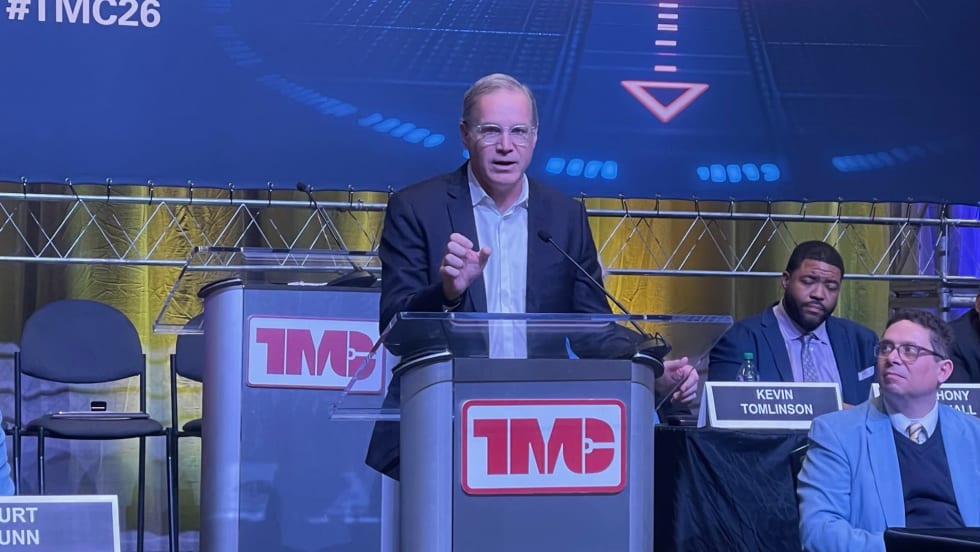
Speaking at the TMC Annual Meeting in Nashville, ATA President Chris Spear said trucking faces mounting pressure from rising fuel prices, geopolitical instability, and uncertainty around trade policy.
Read More →
More than 100,000 new trucking companies enter the industry each year, but regulators manage to audit only a fraction of them. That churn creates opportunities for inexperienced startups — and for “chameleon carriers” that shut down after safety violations and reappear under new identities. Read more from Deborah Lockridge in this commentary.
Read More →
HDTX is an intimate event that connects heavy-duty trucking fleet managers with industry suppliers through small-group discussions, educational sessions, and structured one-on-one meetings.
Read More →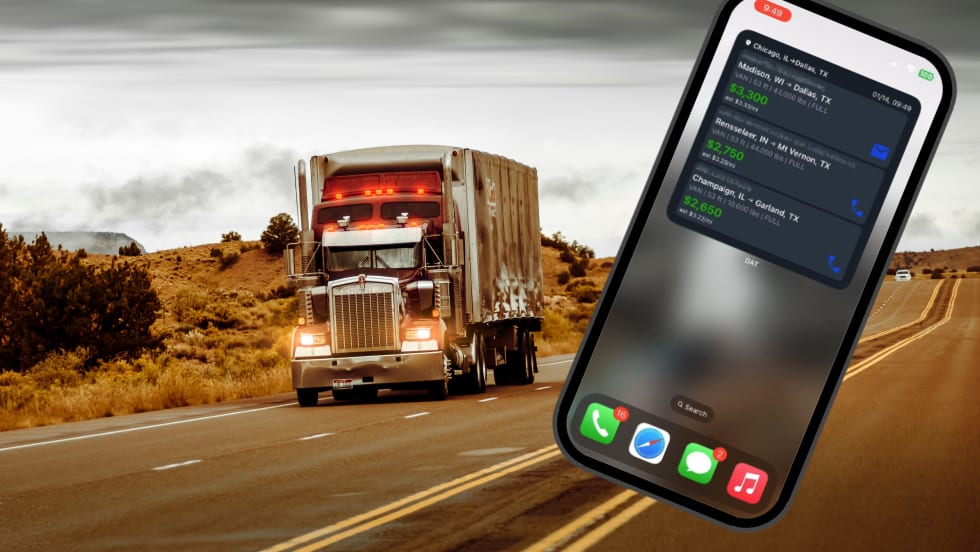
New DAT One feature shows top-paying loads directly on an iPhone’s home screen, helping carriers react faster to spot-market opportunities.
Read More →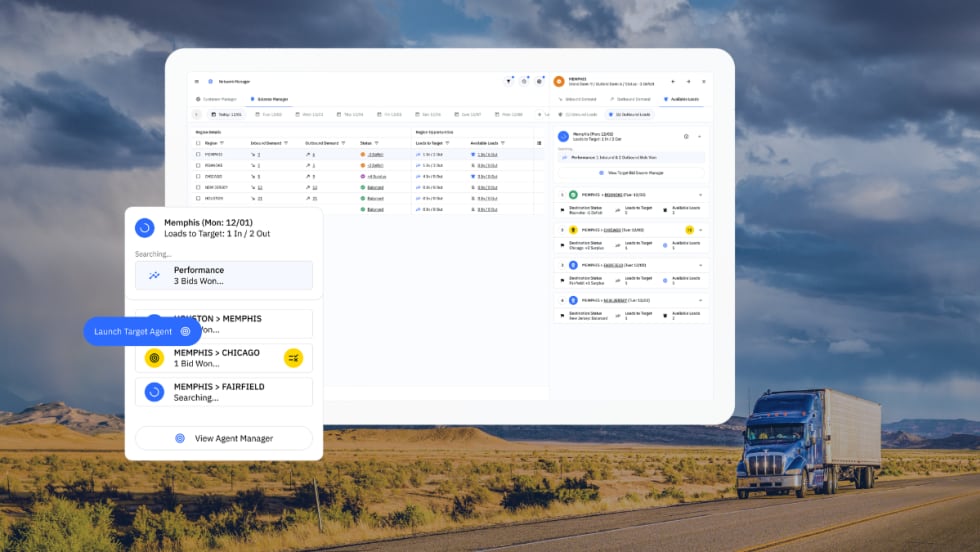
Optimal Dynamics says its new Scale platform uses AI agents and optimization to help carriers find and secure freight that improves network balance and profitability.
Read More →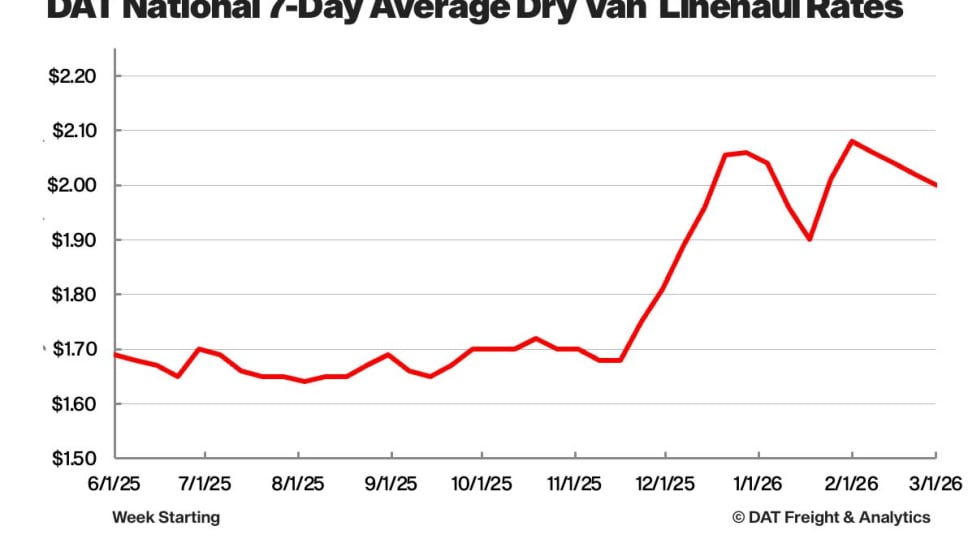
DAT Freight & Analytics data shows tightening flatbed capacity, easing produce markets, and softening van and reefer rates.
Read More →
NACFE's Run on Less - Messy Middle project demonstrates the power of data in helping to guide the future of alternative fuels and powertrains for heavy-duty trucks.
Read More →